Category Archives: Work Related

Previous Work: CSR Interface and Dashboard for MetroLINK (2012)

Static demo (w/ dummy data)

Source code (zip)

Before I begin I want to say that the code here, along with any other code I have posted, is posted with the expressed permission of the company that originally had me write it.

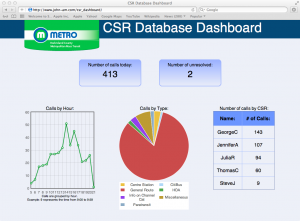
This is something I’ve been anxious to write about, I’m really happy with the results and it helped out quite a bit at MetroLINK.  It’s a web dashboard to show the call data from Metro’s Customer Service Representatives (CSRs).  It pulls data from an Access database through ODBC, and uses PHP to generate the main dashboard as well as the drill-down pages.  The graphs are provided by the excellent Flot javascript library.

Last year it was decided that more information had to be gathered in regards to how many calls the CSRs were taking, and what those calls were about.  Our phone system didn’t support anything beyond basic logging, so until the system could be upgraded something needed to be put in place that would allow the CSRs to track their own calls.  I opted for Access because it was a database system others were already familiar with, and I could make an interface easily enough by using VBA and Access’ own forms.  We saw results almost immediately, and had a much better insight into what the CSRs were doing.

Just using the Access built-in reporting functionality was great, but it was missing the “live” element.  That’s when I decided to start working on this in my spare time.  I discussed what we would need on a dashboard with my co-workers, and then set out to make it happen.

I had some hesitation when I was figuring out how to get the data from the Access file to PHP.  The same file was being used by the CSRs to input this same data, so I had been worried about the file being locked.  The Access forms were already split to avoid this, but I didn’t know how a connection from PHP  would behave.  With ODBC setting up the connection to the Access file was a breeze, and I was pleased to find out it handled multiple connections without issue.  On top of that I could specify that the connection was read-only, providing some security as well.

When I was designing the dashboard I wanted it to have a similar appearance to the public-facing website gogreenmetro.com, so I borrowed the color scheme and title image.  While the data was only changing on each refresh (more on that later) I wanted the dashboard to appear to have activity in it.  To get to this goal I included several hover-over effects and made things respond in useful ways where I could.  Primarily in the graphs and tables where you can highlight parts and get specific information about a point or pie piece.  While it isn’t perfect, it gives the dashboard a little more polish and makes it feel more “alive” than the same page without those elements.

After the main dashboard was completed I started working on the drill-down pages.  They can both be accessed by clicking the numbers for total number of calls and number of unresolved on the main page.  The unresolved drill-down is just a larger version of the breakdown by CSR, which is just building a table.  But the number of calls drill-down introduced some challenges.

On the main page I used the hour function to group calls by hour, and sent that to Flot.  It was simple, and worked for the purposes of the graph.  Moving on to the more advanced graphs though, that method was no longer going to work.  I had to use Flot’s time support, which means I needed to get milliseconds from the Unix Epoch, as that’s JavaScript’s native time format.  None of this was too challenging until timezones entered the picture.  Using Datediff to give me seconds from epoch gave me a sort of “false UTC” that treats the times as if there was no time zone offset.  Since the data would always be correct in the actual database and the presentation wasn’t affected, I saw no problems with this.  It actually encourages it in the Flot API instructions.

Until I checked the tooltips.  JavaScript corrects for time zone when you start using date functions, so all my times were coming in a few hours off.  PHP provides a great way to get the local time zone offset in seconds, so I used that to correct the difference by changing it before the page was rendered.  A side effect of this is that the times change depending on where the page is viewed, so 3pm Central would be 1pm Pacific and so on.  In this context it would probably be a bug, but in other contexts it would be a feature.

In all, this project taught me a lot.  It reinforced my knowledge of things like JSON, HTML/CSS, and how to implement designs to work cross-browser.  It gave me a chance to use PHP for a project, and I learned about it in the process.  Finally, it also gave me a chance to really use Flot and jQuery.  Being able to bring all these things together in one consistent project was a great experience.
Previous Work: Transfer Chart at MetroLINK (2009)

This is my first post in a series detailing some of my previous work.  It serves to remind me of how I accomplished tasks before, formats and techniques I used, and gives me a means to show my work to others if needed.

When I started at Metrolink I was tasked with finding ways to improve their Computer Aided Dispatch / Automatic Vehicle Location (CAD/AVL) system and implement the data it was using.  Part of that process was filling in for dispatchers and learning the routes and stops used by the buses.

The most difficult part of this was sending passenger requested transfers.  They had to be sent from the requesting buses to the receiving buses manually, through the dispatcher.  For a seasoned dispatcher this wasn’t a problem, but in my case I never had enough time on dispatch to really cement in my mind which buses would be at each transfer location.  Eventually I found a way to make a cheat sheet:  I would use SQL to query the scheduling database, giving me an always up-to-date schedule from the current time to about an hour after that.  I would use JSP and Spring to get that information onto a web page and formatted in a way that makes determining where the transfers are going easier.  Then I could access this sheet from any browser to figure out the transfers more quickly, and give it to new dispatches to aid them as well.

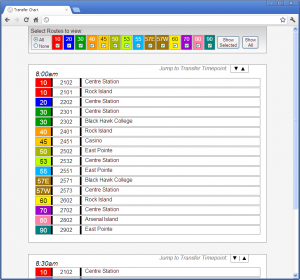
Here is what it looks like, or click here for an offline demo:Metrolink's Transfer Chart

I don’t want to write pages of material about how Metro’s route system works, but suffice it to say that the Route (the colored section) is a path the bus takes, the block number next to it designates different buses on the same route, and the location shown on the right tells you where the bus will be at the time shown on top of the box.  Up top you can filter out just the routes you want to see.

A really basic example of how this would be used is this:  Assume it’s about 7:50am, and I have the screen shown above. I receive a transfer from block number 2102 requesting the Route 30.  Looking over the 8:00am entry, I can see that the 2102 is a route 10 bus that will be at Centre Station at that time.  So now I need to look at the route 30s – there is one that will be at Black Hawk College at 8:00, and another that will be at Centre Station.  The Centre Station bus is the one I want, so I’ll send the message to the bus with the block number 2302.  The whole process takes just a few seconds, which is important because there are a large number of transfers that come in.

When I was designing this I had several objectives in mind, along with making sure the chart functioned correctly.  First I wanted to keep content and presentation as separate as possible.  It makes for cleaner code – especially since this is written in JSP for actual use – and I love the idea of swapping out the CSS and some images for a complete appearance overhaul.  The only portion of this page where I break that ideal is the table up top – the background colors are set on the page.  That said, there isn’t much of a reason to change that table, and doing this via CSS is easy enough by setting an ID for each cell.

I wanted the design to be consistent cross-browser as well.  Unfortunately when dealing with IE6 there is only so much one can hope for, but generally speaking this looks the same no matter how you load it.  And it doesn’t lose functionality in any browser.  That said, since I wrote the code some display inconsistencies have popped up in the newest version of Firefox.  Specifically in how the table is handled in the top menu bar.

This project had its share of problems too, I hadn’t worked with visibility and display CSS settings before, so learning how they worked took some time and made for some unusual results.  This was exacerbated a bit when I added the ability to jump between “time points” where the buses are at one of the transfer locations.  I had to put an anchor link in an invisible div that remained active in the DOM, while not disturbing the rest of the layout, and also jumped to exactly the right position when click.  It took some time tweaking to get all of that working, but I love the results.  When you jump to an item it lines up with the top nearly perfectly.

Also, if I had to do it over I wouldn’t use Spring for this chart.  I had done some internship work at Pearson where I used Spring and JSP to display database information, and having heard about how much easier Spring makes database access I figured it would be foolish not to include it.  But this project only needed one query to be sent on load time, and all the excess that Spring brought to the table wasn’t worth it.  If I had more queries to run it would be a whole different story, but for something this simple I think Spring was excessive.

Overall, I’ve been very happy with how this project turned out and how useful it’s been.  The first day I used it I was nearly able to keep pace with the other dispatchers, and the drivers noticed that I wasn’t taking as long to get them their information.  It was even used for dispatchers in training up until about a month or two ago, when the CAD/AVL system automated the sending of transfers.  Not bad eh?

Blackberry 9900 missing “Mailbox” option in OWA setup.

I’ve been setting up some new Blackberry phones at work, and I’ve run into an issue on the 9900 models.  Sometimes they are missing the “mailbox” option in OWA setup.  From what I’ve seen, the only way to set this up is via the carrier specific Blackberry website*.  You’ll need to use your BlackBerry ID to get in.

If your Blackberry ID doesn’t work, try calling Verizon / your carrier.  In one case here we had to remove the ID and re-create it before it would allow access to those settings via browser.  Good luck!

*Here is Verizons: https://vzw.blackberry.com/html?brand=vzw


Temporarily changing print margins in Access 2003

I didn’t see a good resource for this when I was searching through Google, so I figured I’d type up something 🙂  It’s easy enough to determine through the Excel commands that show up everywhere, but here is a version for Access.

What the code below does is grab your current margin settings, switch them to the settings you need for your form, print, and switch them back afterwards.  The four MsgBox lines are for debugging purposes, since I’ve seen a few different numbers for “points per inch” online.  The most likely numbers are 1440 or 72.

Finally, be sure to switch out DatabaseName.Form_FormNameForm with your Database Name and Form Name as appropriate.

Here is the VBA code:

    'Record set margins.
    'Access records margins in points. There are 1440 points in an inch.
    Dim intPointsPerInch
    intPointsPerInch = 1440

    'Getting the original margins and storing them.
    Dim orgLeftMargin, orgRightMargin, orgTopMargin, orgBottomMargin
    orgLeftMargin = DatabaseName.Form_FormNameForm.Printer.LeftMargin
    orgRightMargin = DatabaseName.Form_FormNameForm.Printer.RightMargin
    orgTopMargin = DatabaseName.Form_FormNameForm.Printer.TopMargin
    orgBottomMargin = DatabaseName.Form_FormNameForm.Printer.BottomMargin

    'These lines are for debuging purposes.
    'They can be left commented out, or even deleted.
    'If your margins are off, these will show you the original margins in points.
    'MsgBox "Left: " & orgLeftMargin, vbOKOnly
    'MsgBox "Right: " & orgRightMargin, vbOKOnly
    'MsgBox "Top: " & orgTopMargin, vbOKOnly
    'MsgBox "Bottom: " & orgBottomMargin, vbOKOnly

    'Here the "1"s are inches for each margin. Replace as needed.
    With DatabaseName.Form_FormNameForm.Printer
    .LeftMargin = 1 * intPointsPerInch
    .RightMargin = 1 * intPointsPerInch
    .TopMargin = 1 * intPointsPerInch
    .BottomMargin = 1 * intPointsPerInch
    End With

    'Print Commands.  Change as needed for your database.
    DoCmd.DoMenuItem acFormBar, acEditMenu, 8, , acMenuVer70
    DoCmd.PrintOut acSelection

    'Changing the margins back.
    With DatabaseName.Form_FormNameForm.Printer
    .LeftMargin = orgLeftMargin
    .RightMargin = orgRightMargin
    .TopMargin = orgTopMargin
    .BottomMargin = orgBottomMargin
    End With

Hope you found this useful!

Cannot make an MDE file in Access, even with a low form / table count.

I was working on an Access Database today, and when I tried to make a new MDE I got the “Microsoft Access was unable to create an MDE database” error.  Specifically, it said I may have too many tables or forms, since the limit was 2048.  Having a total of about 4 forms and 3 tables, I doubted that was the problem.

Turns out if you have a VBScript error the MDE creation will fail as well.   In my case I had deleted a form control but was still referencing it in code.  Fixing that solved the problem.  To do so, open the code editor in access, then go to Tools -> Compile.  If there are any errors it will alert you right away.  Fortunately for me it was just one 🙂

Just another reference for myself.  Thanks for reading!

Configuring LDAP with TWiki

I’m currently trying to get a knowledge base set up at my place of work.  Initially, I had used 68kb to set it up.  It was fantastic to work with (especially after installing TinyMCE as a plug in) but it had no access control or authentication, so management asked I look into alternatives with those features.  I found TWiki and set it up with LDAP / AD (Active Directory) authentication.  Since the documentation wasn’t helping me, I wrote some of my own in case anyone else needs some help, or if I would need to do it again.

Read more »

I have my CCENT!

I received my CCENT certificate in the mail today!  I was so thankful to pass the test, I’m looking forward to studying for the CCNA after New Year’s.

Certificate

I’m taking my time on getting everything posted, but I recently took a trip to North Carolina where I got to tour Microsoft!  I have a few neat pictures from there =D  And I completed the laser I mentioned in this post as well, I’ll post pictures of that as well.

Fast output into TextArea

Note: The example here has been written in VBScript, but the principles should apply to JavaScript as well.

While I was working on the KML generator for work, I wanted a text log to show errors if they came up.  The information wasn’t important enough to save to a file, but it needed to be displayed to the user.  However, as the HTA would go through data, the speed at which the log file would update would become slower and slower, eventually appearing to lock up.  Considering it was dealing with approx. 500kb across three CSV files, this was not acceptable.

Here is a simplified version of the HTA script:

<HEAD>
  <TITLE>KML Generator</TITLE>
  {Omitted}
</HEAD>
<SCRIPT LANGUAGE="VBScript">
Do Until (conditions)
  {Code}
  realTimeOutput.value = realtimeinfo.value & "Message. " & vbCrLf
  Loop
</SCRIPT>
<BODY>
   <textarea id="realTimeOutput" readonly>Waiting for data.</textarea>
</BODY>

The code in red is fine for a quick addition, but terrible for fast successive additions to the textarea.  The content of the textarea was being copied, the addition appended, then the entire value was being written back in.  So, after several searches and attempting other re-workings of that same idea, I found this method of doing it:

realTimeOutput.appendChild(document.createtextnode("Message" & vbCrLf))

In this case everything (except vbCrLf) is carried out via DOM functions, allowing the text to be appended into the textarea without copying everything already in there.  The speed difference was very apparent, as what would come to a near-lockup was now instant.  It seems unusual to create a new text node just to add text, but it’s the only way to update the textarea via the DOM.  In a more memory-sensitive environment, you could assign the node to a variable and null it out as needed. But honestly, at that point I’d ask why VBScript is still being used.

Norton Ghost, Virtual Machines, and weird MBRs.

So, here is something to show you, a physical laptop backup restored into a VirtualBox machine:

Laptop Running in VM

Laptop running in VM

I’m doing this for work, and while it was a fun “just to do it” project, it also served the purpose of testing the backup, and giving us a place to test fixes and (as shown) attempting upgrades.

Ultimately, the backup was done with Norton Ghost 15.0.  I was really hoping to be able to do it with CloneZilla, saving some cash and using Open Source software.  However, no matter what options I entered in that software, it could not restore into the VM. At first I thought it was just the difficulties of moving an OS to another machine. But trying fixes from MergeIDE to UBCD4Win’s Fix IDE / Fix HDC to no avail, it was something else.  I was seeing that there was something detected on the drive – no “Operating System Not Found” error - but it clearly wasn’t loading the OS. 

The fact that this laptop was registering as having 5 partitions, one of which was without a file system, and the other labeled as “DOS” told me that there may be an abnormal MBR structure or partition table in there 😉

When we moved to Ghost, I was seeing the same errors.  Fortunately, Ghost has some extra utilities on their live CD, allowing me to save the MBR and Partition Table separately:

Extra Options in Norton Ghost

Ghost Options

After saving and restoring the MBR and Partition Tables manually, the image booted without issue in the Virtual Machine.  What strikes me as strange is that CloneZilla will back up the MBR and partition table automatically.  This issue shouldn’t have come up with CloneZilla if it’s working as it is supposed to.  I may have to look into that later if I get the time.

If I was looking to do a straight physical to virtual conversion, there are much better options to use.  Disk2Vhd would be one of them, as @CC_DKP pointed out on Twitter.  But the purpose here was just to test a backup, so I was working from a regular backup, not a VHD file.

One last note about Ghost:  While I like 15.0, I can’t recommend it for legacy hardware.  The only reason I got it to work with this laptop is because we installed more RAM.  Worth it?  Completely.  But if the laptop couldn’t take the upgrade we would’ve been dead in the water.