Category Archives: Scripting

Previous Work: Transfer Chart at MetroLINK (2009)

This is my first post in a series detailing some of my previous work.  It serves to remind me of how I accomplished tasks before, formats and techniques I used, and gives me a means to show my work to others if needed.

When I started at Metrolink I was tasked with finding ways to improve their Computer Aided Dispatch / Automatic Vehicle Location (CAD/AVL) system and implement the data it was using.  Part of that process was filling in for dispatchers and learning the routes and stops used by the buses.

The most difficult part of this was sending passenger requested transfers.  They had to be sent from the requesting buses to the receiving buses manually, through the dispatcher.  For a seasoned dispatcher this wasn’t a problem, but in my case I never had enough time on dispatch to really cement in my mind which buses would be at each transfer location.  Eventually I found a way to make a cheat sheet:  I would use SQL to query the scheduling database, giving me an always up-to-date schedule from the current time to about an hour after that.  I would use JSP and Spring to get that information onto a web page and formatted in a way that makes determining where the transfers are going easier.  Then I could access this sheet from any browser to figure out the transfers more quickly, and give it to new dispatches to aid them as well.

Here is what it looks like, or click here for an offline demo:Metrolink's Transfer Chart
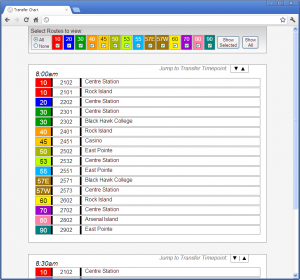
I don’t want to write pages of material about how Metro’s route system works, but suffice it to say that the Route (the colored section) is a path the bus takes, the block number next to it designates different buses on the same route, and the location shown on the right tells you where the bus will be at the time shown on top of the box.  Up top you can filter out just the routes you want to see.

A really basic example of how this would be used is this:  Assume it’s about 7:50am, and I have the screen shown above. I receive a transfer from block number 2102 requesting the Route 30.  Looking over the 8:00am entry, I can see that the 2102 is a route 10 bus that will be at Centre Station at that time.  So now I need to look at the route 30s – there is one that will be at Black Hawk College at 8:00, and another that will be at Centre Station.  The Centre Station bus is the one I want, so I’ll send the message to the bus with the block number 2302.  The whole process takes just a few seconds, which is important because there are a large number of transfers that come in.

When I was designing this I had several objectives in mind, along with making sure the chart functioned correctly.  First I wanted to keep content and presentation as separate as possible.  It makes for cleaner code – especially since this is written in JSP for actual use – and I love the idea of swapping out the CSS and some images for a complete appearance overhaul.  The only portion of this page where I break that ideal is the table up top – the background colors are set on the page.  That said, there isn’t much of a reason to change that table, and doing this via CSS is easy enough by setting an ID for each cell.

I wanted the design to be consistent cross-browser as well.  Unfortunately when dealing with IE6 there is only so much one can hope for, but generally speaking this looks the same no matter how you load it.  And it doesn’t lose functionality in any browser.  That said, since I wrote the code some display inconsistencies have popped up in the newest version of Firefox.  Specifically in how the table is handled in the top menu bar.

This project had its share of problems too, I hadn’t worked with visibility and display CSS settings before, so learning how they worked took some time and made for some unusual results.  This was exacerbated a bit when I added the ability to jump between “time points” where the buses are at one of the transfer locations.  I had to put an anchor link in an invisible div that remained active in the DOM, while not disturbing the rest of the layout, and also jumped to exactly the right position when click.  It took some time tweaking to get all of that working, but I love the results.  When you jump to an item it lines up with the top nearly perfectly.

Also, if I had to do it over I wouldn’t use Spring for this chart.  I had done some internship work at Pearson where I used Spring and JSP to display database information, and having heard about how much easier Spring makes database access I figured it would be foolish not to include it.  But this project only needed one query to be sent on load time, and all the excess that Spring brought to the table wasn’t worth it.  If I had more queries to run it would be a whole different story, but for something this simple I think Spring was excessive.

Overall, I’ve been very happy with how this project turned out and how useful it’s been.  The first day I used it I was nearly able to keep pace with the other dispatchers, and the drivers noticed that I wasn’t taking as long to get them their information.  It was even used for dispatchers in training up until about a month or two ago, when the CAD/AVL system automated the sending of transfers.  Not bad eh?

Working with webOS Enyo Web services in Google Chrome

The options described below are very useful for development, but equally dangerous. Enabling these options is a huge security risk and should not be used for normal browsing.

If you need these options enabled but still want to browse, please consider using Chromium as a development browser with these options.

I’ve been writing code for in HP’s new Enyo framework for webOS, and a constant issue has been that WebServices can only be run in the emulator.  Webservices are Enyo’s abstraction of XMLHttpRequest, basically.  One of Enyo’s biggest strengths is that it can be tested in any Webkit based browser, but when you get to the internet access portion of testing (usually the biggest part!) you have to move to the emulator.

Fortunately, there is a fix!  As noted above, do not leave this on by default as it is a huge security risk.  This disables the file access and same origin protections, allowing you to perform webservices calls in Chrome.

To do this, run Chrome with the following command line options:

--allow-file-access-from-files --disable-web-security

In windows, you can add these to a shortcut (after the quotes, if present) just be sure to make the double hyphens a single hyphen.  On OSX you can copy and paste the command line options above.  For OSX you’d want to use a script unless you want to run it from the command line each time.  If you’ll be spending a lot of time within Enyo, you may want to download Chromium and use that for development work.  Again, browsing with these options enabled is a significant security risk.

Thanks for reading!

Making Circles in Google Charts – Undocumented Chart Types for Google Charts

So it looks like the Google Charts API has a couple of small undocumented charts in it!

There isn’t anything I can find about this written elsewhere, so here is my personal documentation for it.  The information here has been distilled from the MarkerIconCreator webpage. Where you can play with these chart types to have the URLs created for you.  I had to look all of this up for the KML generator I mentioned a few posts ago.

Circle (chart type it): Circle Example - With "X" in the middle.

Parameters: cht=it&chs=32×32&chco=FF0000,000000ff,ffffff01&chl=X&chx=FFFFFF,0&chf=bg,s,00000000

The important part to note is cht=it.  That chart type is not documented in the Google Charts API. 

Rounded Rectangle (chart type itr): Rounded Rectangle

Parameters: cht=itr&chs=32×32&chco=FF0000,000000ff,ffffff01&chl=X&chx=FFFFFF,0&chf=bg,s,00000000

Again, note cht=itr.

There are some other parts in both URLs  which are different from the documentation in how they’re used.  It’s not too hard to figure out via trial and error; but here are some quick explanations:

Color: chco=FF0000,000000ff,ffffff00

The API shows chco as series color, but it’s used a little bit differently for this chart type.  The first color is your shape color.  The second is your first shadow color, and the third is your background-shadow color.  These are regular hexidecimal colors, but with an added byte of values on the end to represent transparency.  If you are using this in a KML file, I recommend setting both shadow colors to 00.

Here are some examples with chco=00FF00,FF0000ff,0000ffAA: chco=00FF00,FF0000ff,0000ffAA chco=00FF00,FF0000ff,0000ffAA

Label Color: chx=FFFFFF

Chx doesn’t exsit on its own in the API. Other forms do, like chxt, chxr, etc.  It is the color for the label text.  It also supports adding an extra byte at the end for transparency.

Here are some examples with chx=00FFFF: Label Color Examplechx=00FFFF

Background color (gradient?): chf=bg,s,00000000

Chf is listed in the official documentation as a fill option.  Only the solid variety works here.  Then the coloring is the same Hex + transparency we’ve seen above. 

Here are the examples, chf=bg,s,00AA00FF: chf=bg,s,00AA00FF chf=bg,s,00AA00FF

Building a self-contained HTA with embedded Images and Icons.

I’m working on an HTA to generate KML files from a given CSV.  I’ve set a goal for myself to keep everything contained in the one HTA file.  Being HTML / CSS and VBScript, this is easy for the most part.  Images and icons are a little harder though. But not impossible!

For images, look at Data URI schemes.  I’ll borrow Wikipedia’s example here:

<img src="data:image/png;base64,
iVBORw0KGgoAAAANSUhEUgAAAAoAAAAKCAYAAACNMs+9AAAABGdBTUEAALGP
C/xhBQAAAAlwSFlzAAALEwAACxMBAJqcGAAAAAd0SU1FB9YGARc5KB0XV+IA
AAAddEVYdENvbW1lbnQAQ3JlYXRlZCB3aXRoIFRoZSBHSU1Q72QlbgAAAF1J
REFUGNO9zL0NglAAxPEfdLTs4BZM4DIO4C7OwQg2JoQ9LE1exdlYvBBeZ7jq
ch9//q1uH4TLzw4d6+ErXMMcXuHWxId3KOETnnXXV6MJpcq2MLaI97CER3N0
vr4MkhoXe0rZigAAAABJRU5ErkJggg==" alt="Red dot" />

It’s a bit longer than the usual <img src=”image.png” alt=”Image”> tag. But it allows for images in an HTA without additional files.  The way it works is by taking the file you want to embed, and converting it to Base64.  There are several online tools to do this, but I’ve been using this command line utility for the sake of bandwidth.

Once you have the blob of Base64 data, start an image tag with the src attribute set to “data:image/png;base64,” and append the data afterward.  The first part is needed to tell the browser what the image type is, and the encoding.  The image type doesn’t need to be PNG, any type can be used as long as the MIME type is changed accordingly.  Data URI’s work for most media types, so other things besides images can be embedded this way.

Note that because HTAs are rendered in IE, you’ll need to be aware of your target audience for this to work.  IE8 only supports data URIs up to 32KB.  IE7 and IE6 compatibility is not there, although it may be possible through this MHTML /CSS hack.  I’ll have to test it once my HTA is ready to go.

Now for Icons.  I found this piece of information on the MSDN page for the HTA Icon property.  The solution is to use the copy command, which will append the icon data onto the front of the HTA.  Before the HTML starts.

First, add this line to your HTA to specify the icon. If you have an hta: application tag already, you can add the “icon=”#”” line to it:

<hta:application icon="#">

Then, open a command prompt, and use this command, substituting the appropriate names:

copy icon.ico /b /y +original.hta originalWithIcon.hta

The + before original.hta tells the copy command to append that file onto the file being copied. With originalWithIcon.hta being the output file. /b tells copy that icon.ico is a binary file. And /y just suppresses the overwrite messages.

At this point, if you open the new HTA in a text editor you’ll see some unreadable characters before the HTML starts. That is the icon data.  With that embedded, the icon will now appear in your system tray when you run the file.  Unfortunately (at least on Windows XP) it doesn’t show up in Explorer.

Now you have an HTA with embedded images and Icons!